From Insight to Interface: Building a UX Research Tool with AI Collaboration

As a UX researcher and strategist, I’m always thinking about how to make decision-making easier, faster, and more grounded in evidence — not assumptions. Some of the more frequent questions I get while working are:

“How big of a sample size do we need? Why does it have to be that big? How confident are we in the results?”

These questions are deceptively simple — and incredibly important. So I set out to build a tool that could help answer them quickly and visually.

But rather than mock something up and pass it off to an engineer, I wanted to try something different:

Could I collaborate with an AI (ChatGPT) to build, iterate, and deploy a live web app myself — no dev team required?

The Tool: A Sample Size Confidence Estimator

The result is a live tool that:

  • Shows how much your survey might cost depending on your per-response rate
  • Calculates your estimated confidence level based on your current sample and population size
  • Compares your sample size to the required sizes for 85%, 90%, and 95% confidence
  • Offers clear, plain-language explanations of margin of error and confidence intervals

You can try it live here:

 Sample Size Confidence Estimator

The UX Behind the Interface

This wasn’t just a code experiment — it was driven by UX strategy:

  • I identified a recurring pain point from stakeholders and researchers
  • I mapped out what users need to know — and when — to feel confident in their decisions
  • I focused on reducing cognitive load, with simple sliders, contextual tooltips, and visual benchmarks
  • I designed for progressive disclosure: advanced options like finite population correction are there if you need them, but stay out of the way otherwise

Building With AI (and Not Just Asking for Code)

What made this project special was how I used AI as a creative collaborator, not just a code monkey:

  • I asked questions like “How would we calculate confidence based on margin of error?” and “How should the slider respond at different ranges?”
  • I got help debugging build issues, refactoring the interface, and improving clarity
  • I used the AI to make statistical methods more accessible, turning abstract math into readable, plain-language explanations

This wasn’t a prompt-and-go project. It was an ongoing conversation with the model — much like pair programming or rubber duck debugging — and it let me iterate fast.

Why This Matters

I’m proud of this tool not just because it works — but because it’s a small example of what happens when UX, research, strategy, and modern tools all come together. It reflects how I like to work:

  • Grounded in real user needs
  • Thinking from both the researcher’s and stakeholder’s perspective
  • Open to experimentation and technology — even if it means learning by doing

Whether you’re a fellow researcher, designer, or strategist: I hope this tool helps you get better answers, faster.

And if you’re a hiring manager or collaborator? Let’s talk about what we could build together next.

Understanding the Customer Support Experience

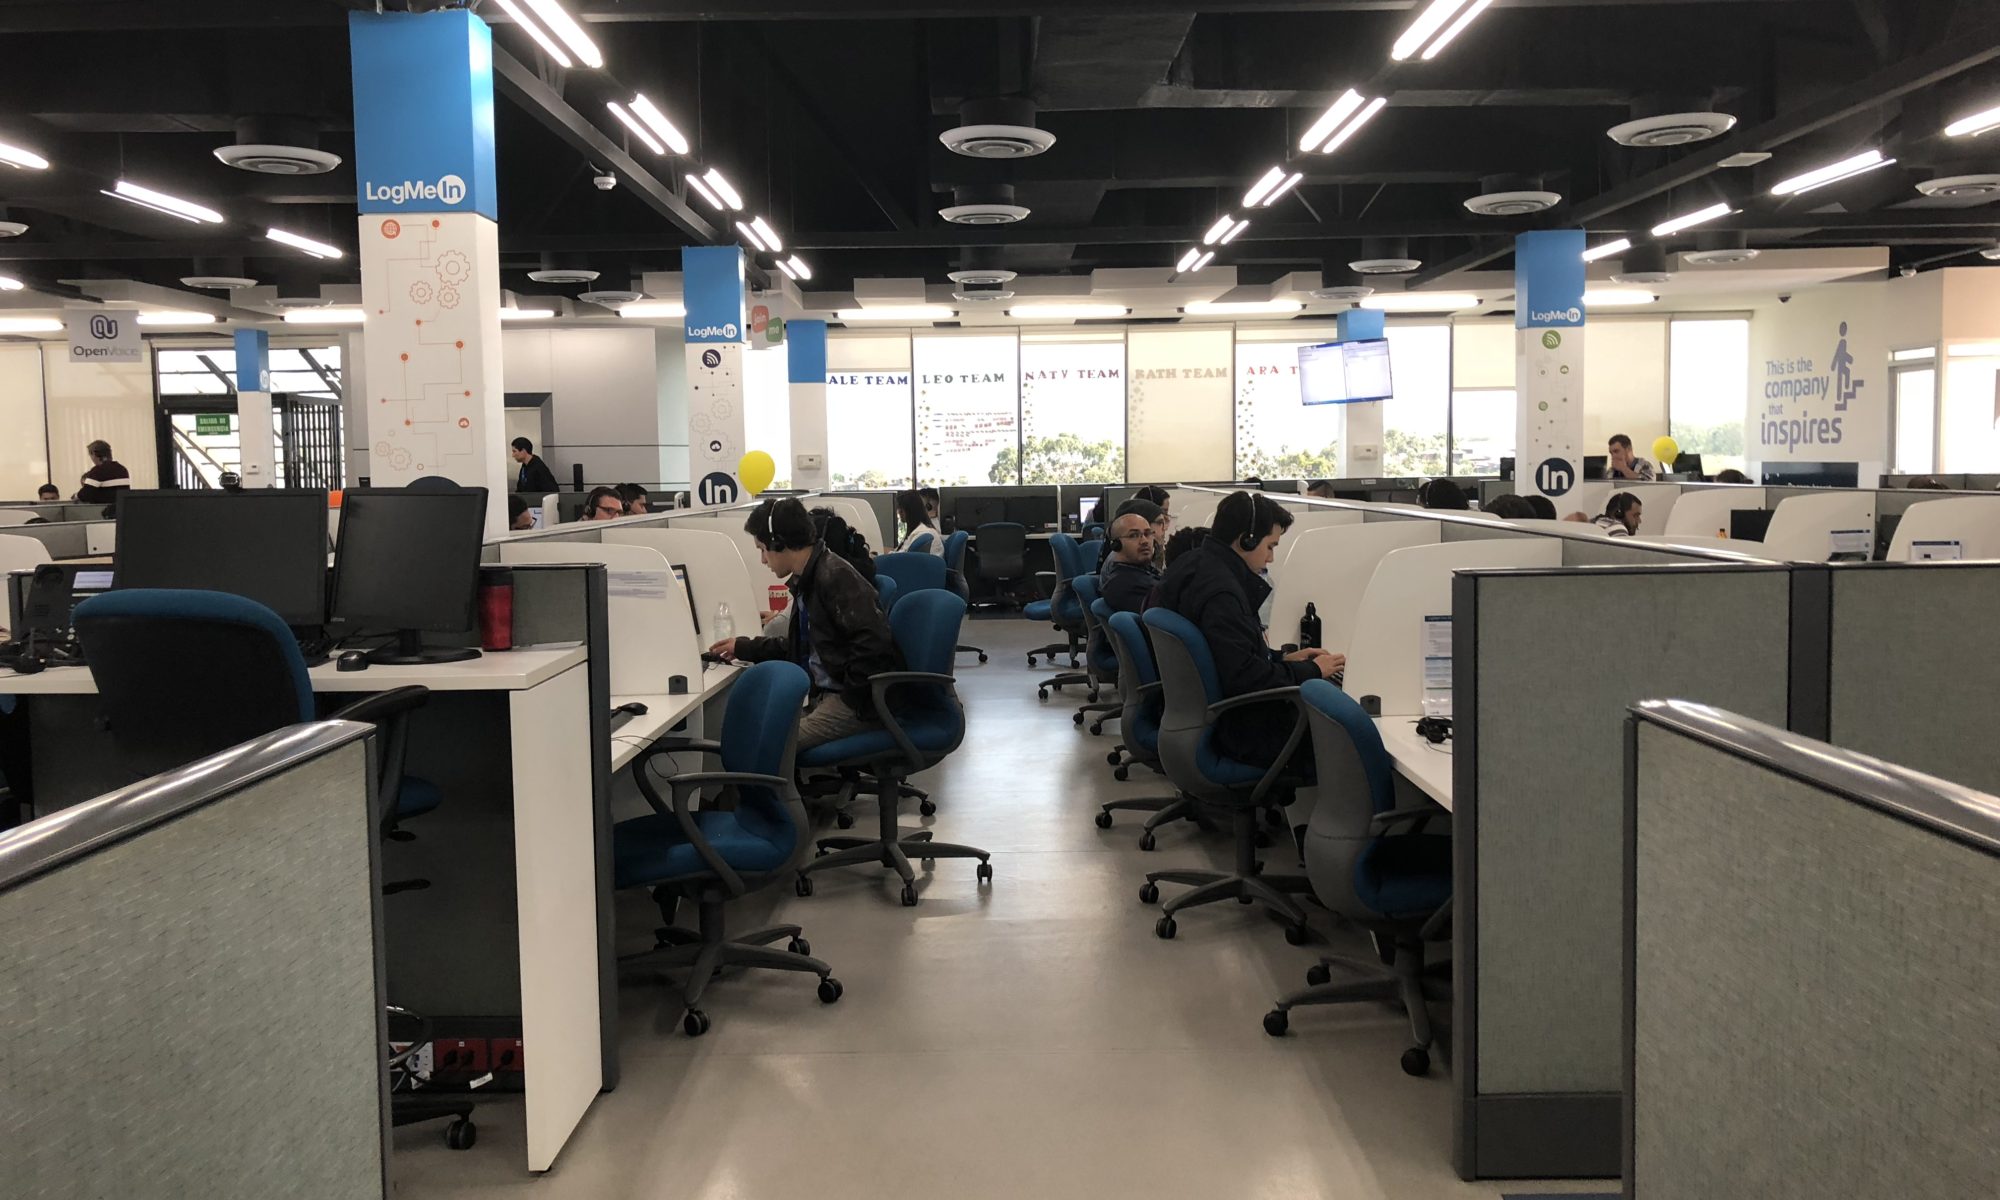
Image of a telephone support office with rows of desks

Understanding the Support Experience

M. Fraser, Sr. UX Researcher

J. Swartz, Assoc UX Researcher

R. Zelaya, CX Researcher

Agents as a function of CARE were seen as a pain point in the following ways

  • Financially
  • Time taken to resolve cases was higher than average
  • tNPS scores were unsatisfactory

A solution suggested was to redesign the agent dashboard. A list of features, possible designs and improvements and ways of understanding the process were seen as the potential outcomes.  Since we had very little knowledge of what the day to day needs and work of our care agents, so designed a research project getting at this knowledge

Initial exploration

Reviewing the care rep performance data uncovered an unexpectedly long amount of time both during and after the care calls. We had expected the average call to be 5-10 minutes but the average call was 12 minutes or more. In addition, resolution rates were lower than expected possibly meaning repeat calls by the customer to resolve their issue leading to higher than expected call volume.

Methods:

We used a primary and secondary methodology to identify impacts on time.

The primary methodology was contextual in nature.   We shadowed and interviewed agents during the process of answering calls.  We attempted to understand their normal work flow and understand the pain points associated with the process.  We investigated tools, dashboards, and systems used to handle calls. The end goal here was to quantify product issues and customer facing issues.

Care agent interview
A follow-up interview after a call shadowing session

The second was a cafe study.  We chatted with agents over coffee one-on-one and spoke about their day-to-day experiences, specifically asking about the pros and cons of working at the call center.   This was done to understand the motives behind their process and work life. We interviewed the agents outside of the work environment and asked about their day to day lives, commuting, living situation etc. We took them out of the work environment to give them a space to vent about their jobs and lives without a manager’s presence influencing their answers or speech. We wanted to understand their lives in order to streamline their workspace thus ensuring a greater ability to manipulate dashboards and other tools.

Results

Affinity mapping revealed a few themes.

First, we noticed there were organizational processes which increased customer effort. For example: our partners in costa rica would hold a required manager’s meeting each morning for 15-20 minutes. However managers were part of a required business process for refunds approval. If a customer was unlucky enough to call during this time they would have to wait longer for help with a simple business process.

We also learned about frustrations with tools the agents were equipped with. For instance for security reasons agents weren’t allowed able to download or save files. So if a customer wanted a report of their usage,  a supervisor or manager had to download the file to email it to the customer. This was problematic as agents couldn’t take notes of their calls to save for follow ups. In short, agents were denied simple procedural behaviors that would allow them to do their job quickly, creating a longer time on task.

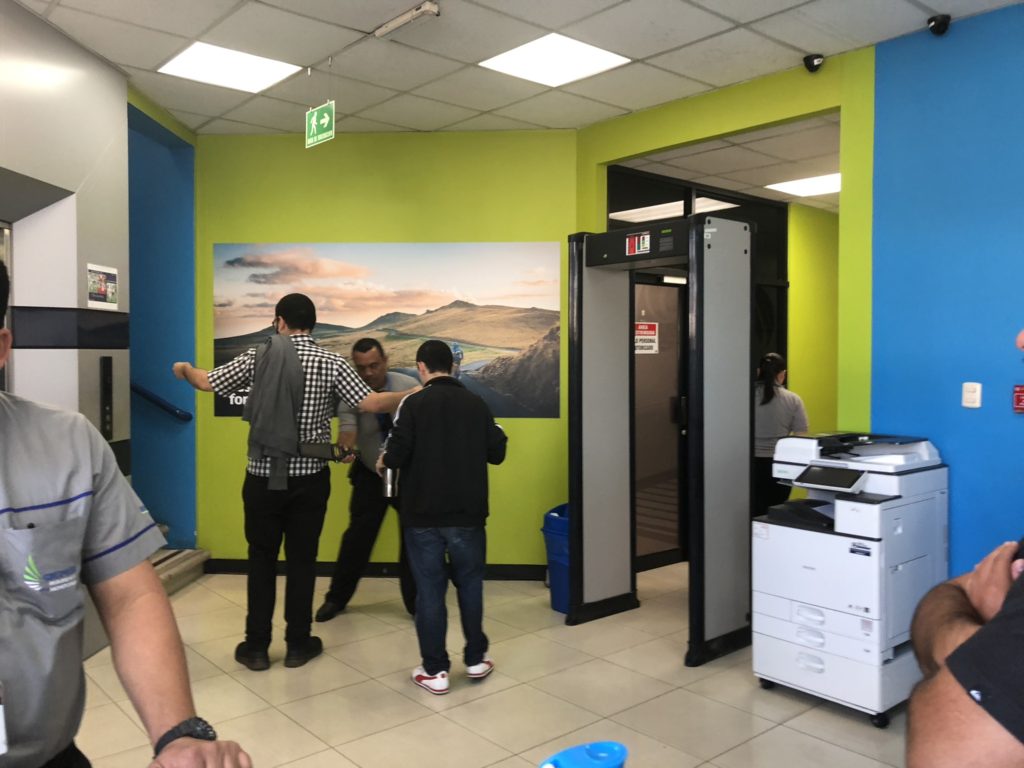
Image of an employee going through security

Additionally, we noticed the work culture at the partner site led to distrust.  Regular security checks, the aforementioned security restrictions and a lack of mobile devices (needed to troubleshoot mobile applications). We recommended a renegotiation of contract with our near shore partners, or a return to having internal customer care teams.

Outcomes

Customer care operations are moving back in house. This affords greater control over tools and processes, so agents and customers  are set up for a lower effort experience.

Agents are now given the same permissions as supervisors, and are trained to use their own judgment for refunds and other issues that would have required supervisor intervention.

FInally a culture of trust is fostered. Agents are now a part of our company and not external resources hired for a 3rd party contract. This creates a sense of belonging and trust in our representatives who are on the front lines of our customer experience.

Napses Mobile

Napses was an awesome experience and during my relationship with them I was driven to fully explore my curiosity in UX.  When I first joined them it was the Summer after I had graduated college. We were all feeling a little disappointed by the technology that was being used as a CMS for classrooms during our last years at school and felt that there could be a better way of managing a college course.
Continue reading “Napses Mobile”